Chart widget
Chart widget is a CoSApp Lab widget allowing users to create the plots with data from a CosApp system. Users can use chart widget in notebook as a JupyterLab widget or use it in SysExplorer.
Start chart widget
To open ChartWidget inside SysExplorer, just select Chart widget in widget menu of any section.
To use ChartWidget as a JupyterLab widget, users can import it from cosapp_lab.widgets, the required input parameter is an instance of CosApp system. In default mode, ChartWidget will be opened on a side panel of JupyterLab interface, to modify the position of widget, user can user anchor keyword as SysExplorer widget.
from cosapp_lab.widgets import ChartWidget
demo = AnyCosappSystem("demo")
a = ChartWidget(demo, anchor = "tab-after")
Chart widget main interface
Chart widget contains a large viewer window and a toolbar at the bottom.
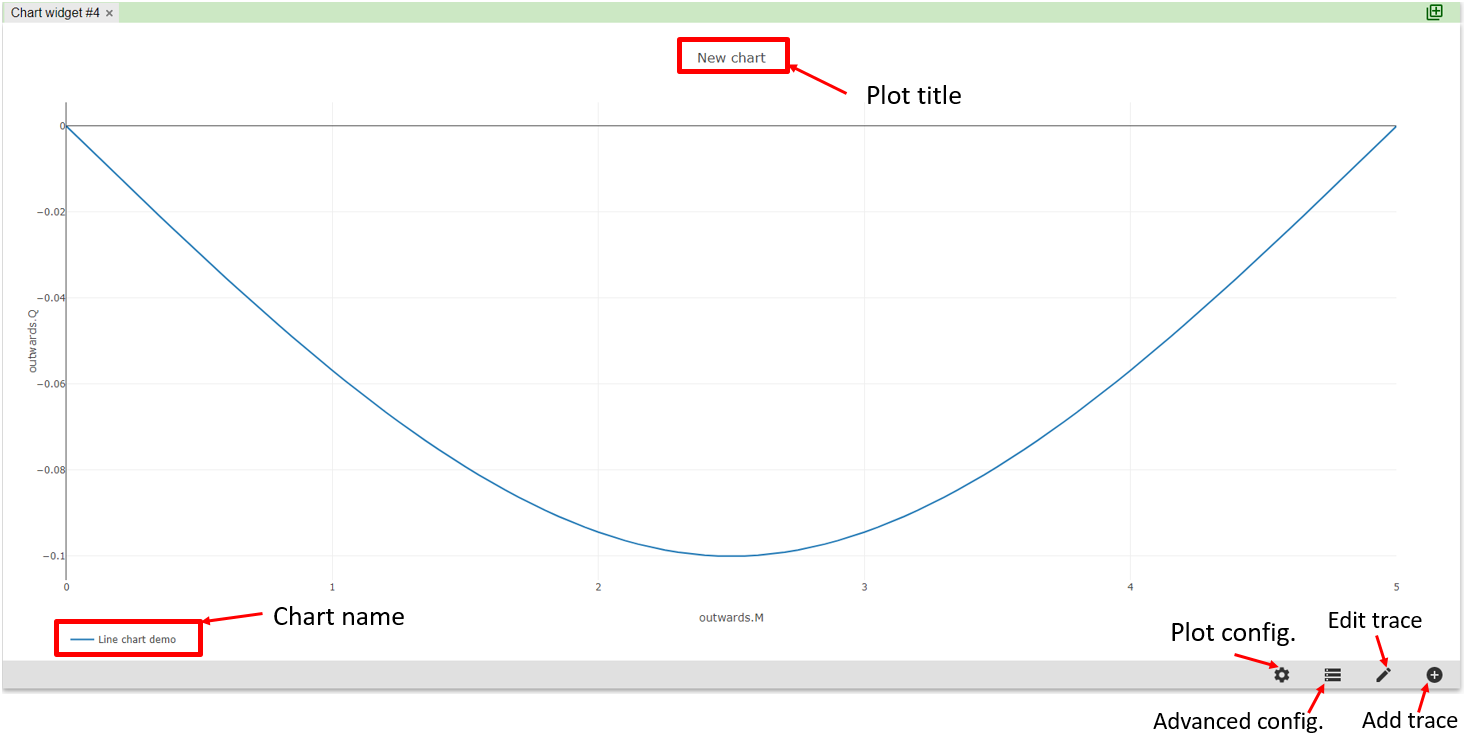
The toolbar in the bottom of interface is consisted of 4 buttons:
Add trace: Open add trace dialog.
Edit trace: Open edit trace dialog.
Advanced configuration: Open advanced configuration dialog.
Plot configuration: Open layout configuration dialog.
Trace adding dialog
This dialog is used to create a new trace of append another trace to plot tab.
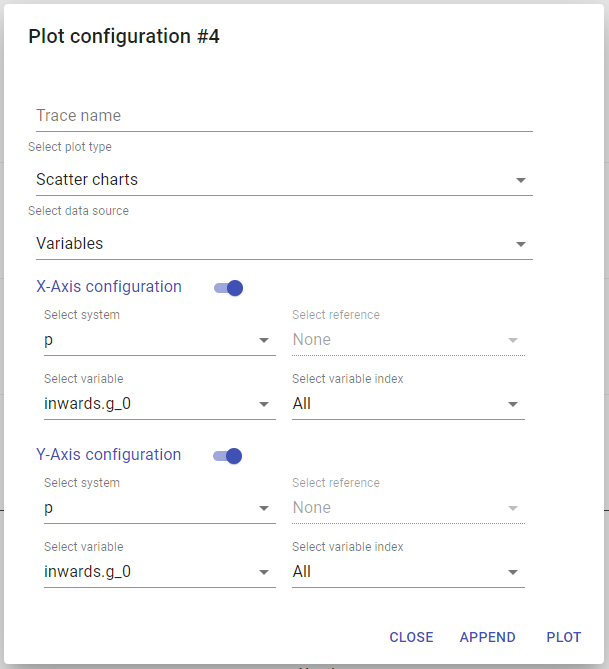
Trace name input: The name of new chart, since a plot tab can contain multiple charts, the name of each chart need to be unique.
Plot type selector: User can select the type of plot between Scatters chart, Line chart and Bar chart.
Data source selector: User can select the data to plot between the value of variables Variables, the data in recorders Recorders or the solver residues data in Driver data.
X-Axis configuration switch: The switch to activate of deactivate the configuration for X-Axis, the same switch applies to Y-Axis. If X-Axis is deactivated, the index of data of Y-Axis is used as X-Axis data, if both axes are deactivated, no trace will be plotted.
Select system/ Select recorder selector: Depend on data source, this selector is used to set the system or the recorder where user want to get data from.
Select reference selector: Only applied to Recorders data source, this selector is used to select the reference of data in recorder. For multi-point case, each reference is a design point, for transient case, each reference is a time step. If user specifies a reference, data will be get on the corresponding line of recorder, if All is chosen, data will be get from selected column.
Select variable selector: This selector is used to set the data source to a variable of system or a column of recorder.
Select variable index: In case of the variable is a vector, users can specifies the index of value they want to plot, if All is selected, value of each index will be plotted.
Plot button: This button will clear all existing traces in plot tab and create a new trace with the configuration from dialog.
Append button: This button will add a new chart to the plot tab, if a trace with same name exists, this trace will be overwritten.
Trace editing dialog
This dialog is used to edit the existing traces in plot tab. It contains the data configuration like in trace adding dialog with some additional inputs.
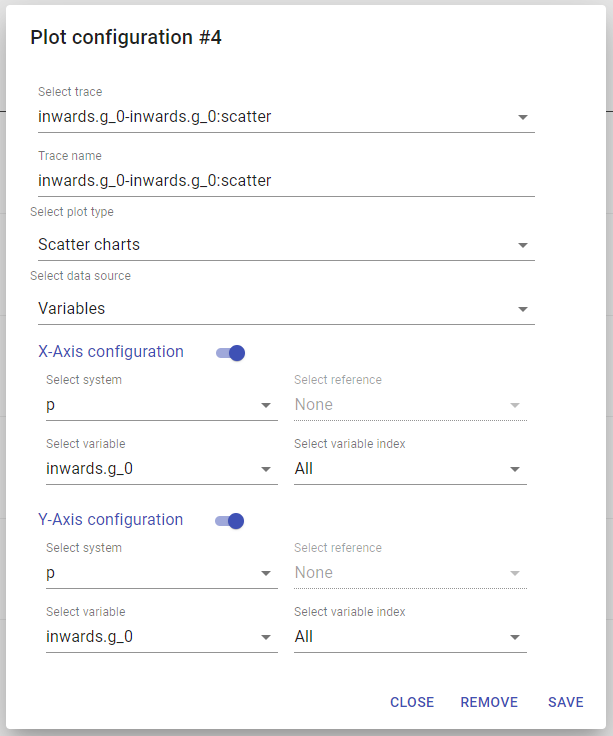
Select trace selector: This selector is used to select the chart to edit.
Trace name input: Input used to edit the name of selected chart.
Remove button: Remove selected charts from plot tab.
Save button: Update selected chart with new configuration.
Advanced trace configuration dialog
This dialog is used to modify the underlying Plotly configuration of traces. Use can modify directly the trace like color, font size, ect…
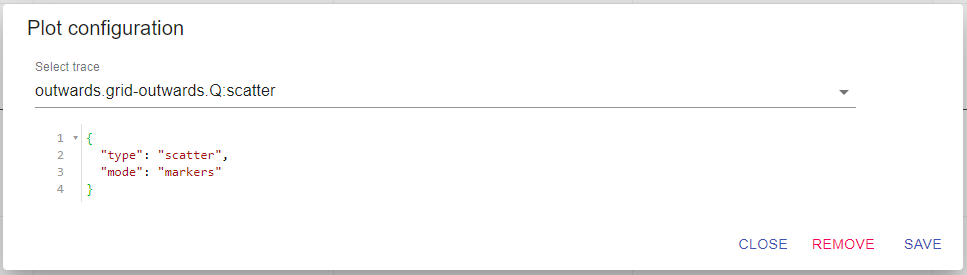
Select trace selector: This selector is used to select the trace to edit.
Remove button: Remove only the advanced configuration of selected trace.
Save button: Update selected trace with new configuration.
Plot layout dialog
This dialog is used to configure the layout of current plot tab.
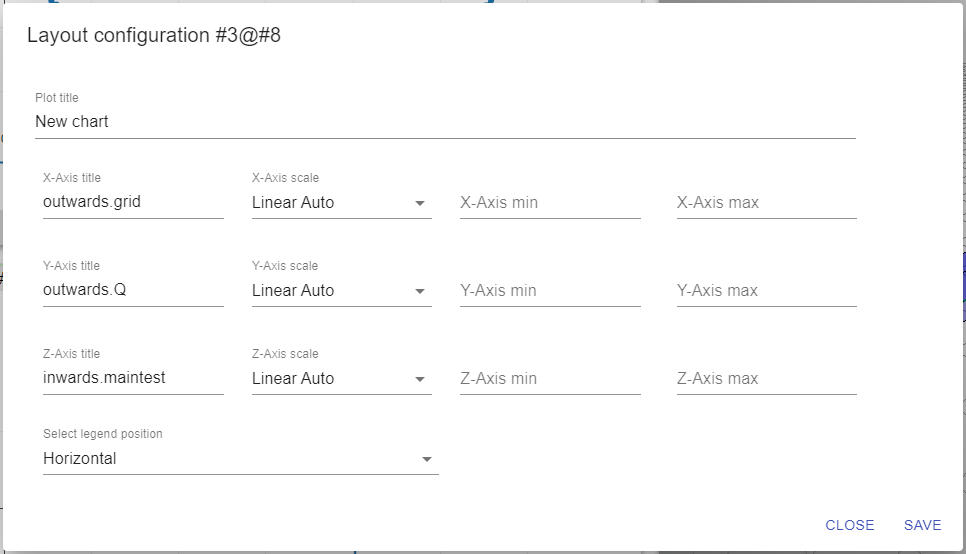
Plot title: input to edit the title of plot.
X/Y/Z Axis title: input to edit the title of axes.
X/Y/Z Axis scale: selector to switch between scale mode :Linear (auto/fixed) or Log(auto/fixed) of axis.
Legend position: selector to switch the position of legend (Horizontal or Vertical).